Correlation network
Xiaotao Shen (https://www.shenxt.info/)
Created on 2022-02-18 and updated on 2022-09-19
Source:vignettes/correlation_network.Rmd
correlation_network.RmdData preparation
library(massstat)
library(magrittr)
library(dplyr)

data("liver_aging_pos")
liver_aging_pos
#> --------------------
#> massdataset version: 0.01
#> --------------------
#> 1.expression_data:[ 21607 x 24 data.frame]
#> 2.sample_info:[ 24 x 4 data.frame]
#> 3.variable_info:[ 21607 x 3 data.frame]
#> 4.sample_info_note:[ 4 x 2 data.frame]
#> 5.variable_info_note:[ 3 x 2 data.frame]
#> 6.ms2_data:[ 0 variables x 0 MS2 spectra]
#> --------------------
#> Processing information (extract_process_info())
#> Creation ----------
#>       Package         Function.used                Time
#> 1 massdataset create_mass_dataset() 2021-12-23 00:24:02

qc_id <-
  liver_aging_pos %>%
  activate_mass_dataset(what = "sample_info") %>%
  dplyr::filter(group == "QC") %>%
  dplyr::pull(sample_id)

object <-
  mutate_rsd(liver_aging_pos, according_to_samples = qc_id)

###only remain the features with rt > 100, mz > 150 and rsd < 30
object <-
  object %>%
  activate_mass_dataset(what = "variable_info") %>%
  dplyr::filter(rt > 100) %>%
  dplyr::filter(mz > 150) %>%
  dplyr::filter(rsd < 30)

##only remain the week 24 samples
object <-
  object %>%
  activate_mass_dataset(what = "sample_info") %>%
  dplyr::filter(group == "24W")

dim(object)
#> [1] 751  10

object <-
  object %>%
  `+`(1) %>%
  log(10) %>%
  scale_data(method = "auto")
Correlation network
graph_data <-
  convert_mass_dataset2graph(
    object = object,
    margin = "variable",
    cor_method = "spearman",
    p_adjust_cutoff = 1,
    p_value_cutoff = 0.0001,
    pos_cor_cutoff = 0.7,
    neg_cor_cutoff = -0.7
  )

graph_data
#> # A tbl_graph: 147 nodes and 90 edges
#> #
#> # An undirected simple graph with 60 components
#> #
#> # Node Data: 147 × 4 (active)
#>   node         mz    rt   rsd
#>   <chr>     <dbl> <dbl> <dbl>
#> 1 M154T438   154.  438. 22.8
#> 2 M159T338   159.  338. 14.1
#> 3 M164T220   164.  220.  6.31
#> 4 M171T494   171.  494. 11.4
#> 5 M171T1363  171. 1363. 28.4
#> 6 M171T1349  171. 1349. 10.3
#> # … with 141 more rows
#> #
#> # Edge Data: 90 × 6
#>    from    to correlation    p_value number p_adjust
#>   <int> <int>       <dbl>      <dbl>  <int>    <dbl>
#> 1    11    16       0.976 0.00000147     10   0.0413
#> 2    12    17       0.952 0.0000228      10   0.134
#> 3    14    18       0.964 0.00000732     10   0.0937
#> # … with 87 more rowslibrary(ggraph)
extrafont::loadfonts()
ggraph(graph = graph_data, layout = "kk") +
geom_edge_fan(aes(color = correlation,
width = -log(p_value, 10)),
show.legend = TRUE) +
geom_node_point(aes(size = mz)) +
theme_graph()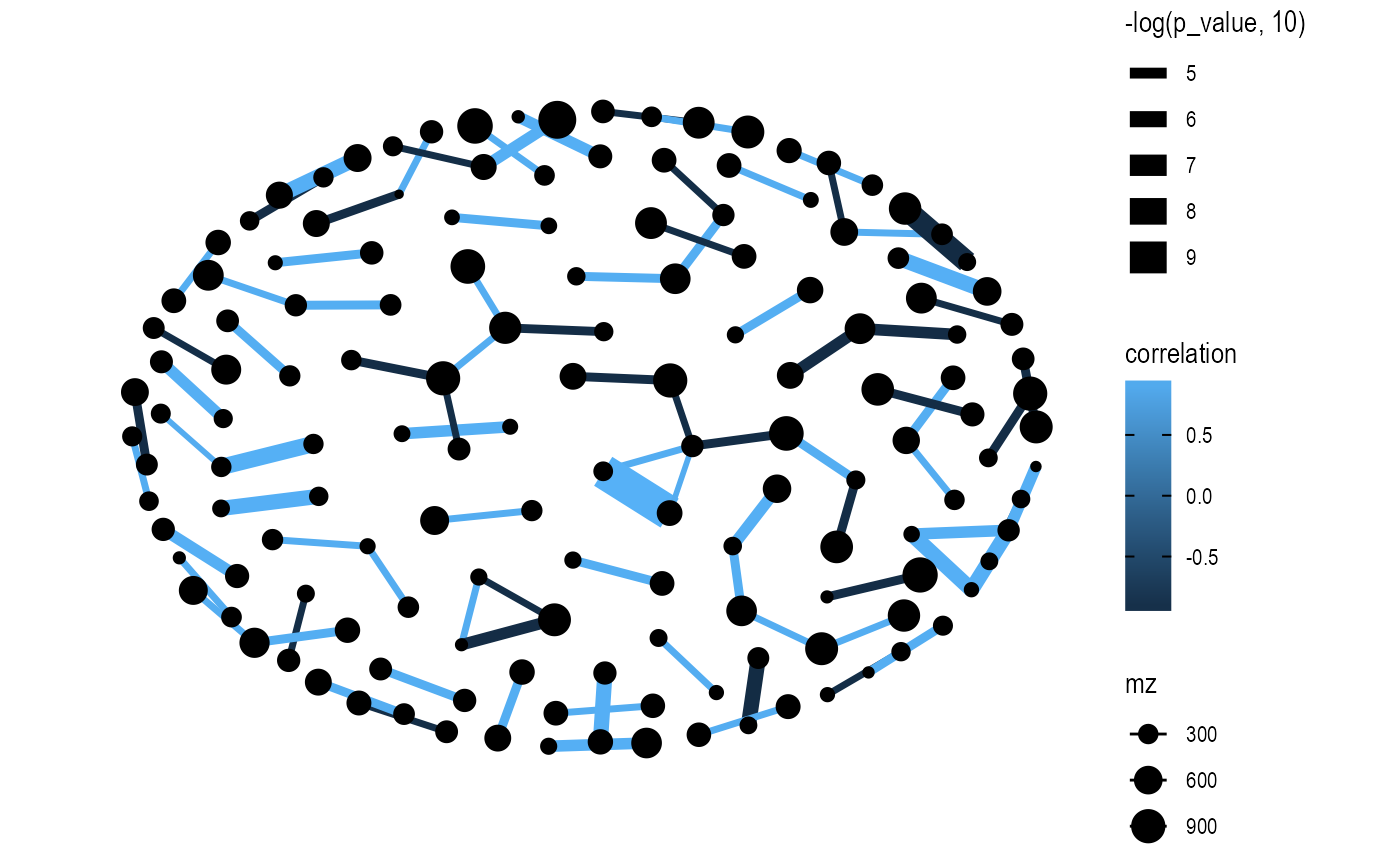
ggraph(graph = graph_data, layout = "fr") +
  geom_edge_fan(aes(color = correlation,
                    width = -log(p_value, 10)),
                show.legend = TRUE) +
  geom_node_point(aes(size = mz)) +
  theme_graph()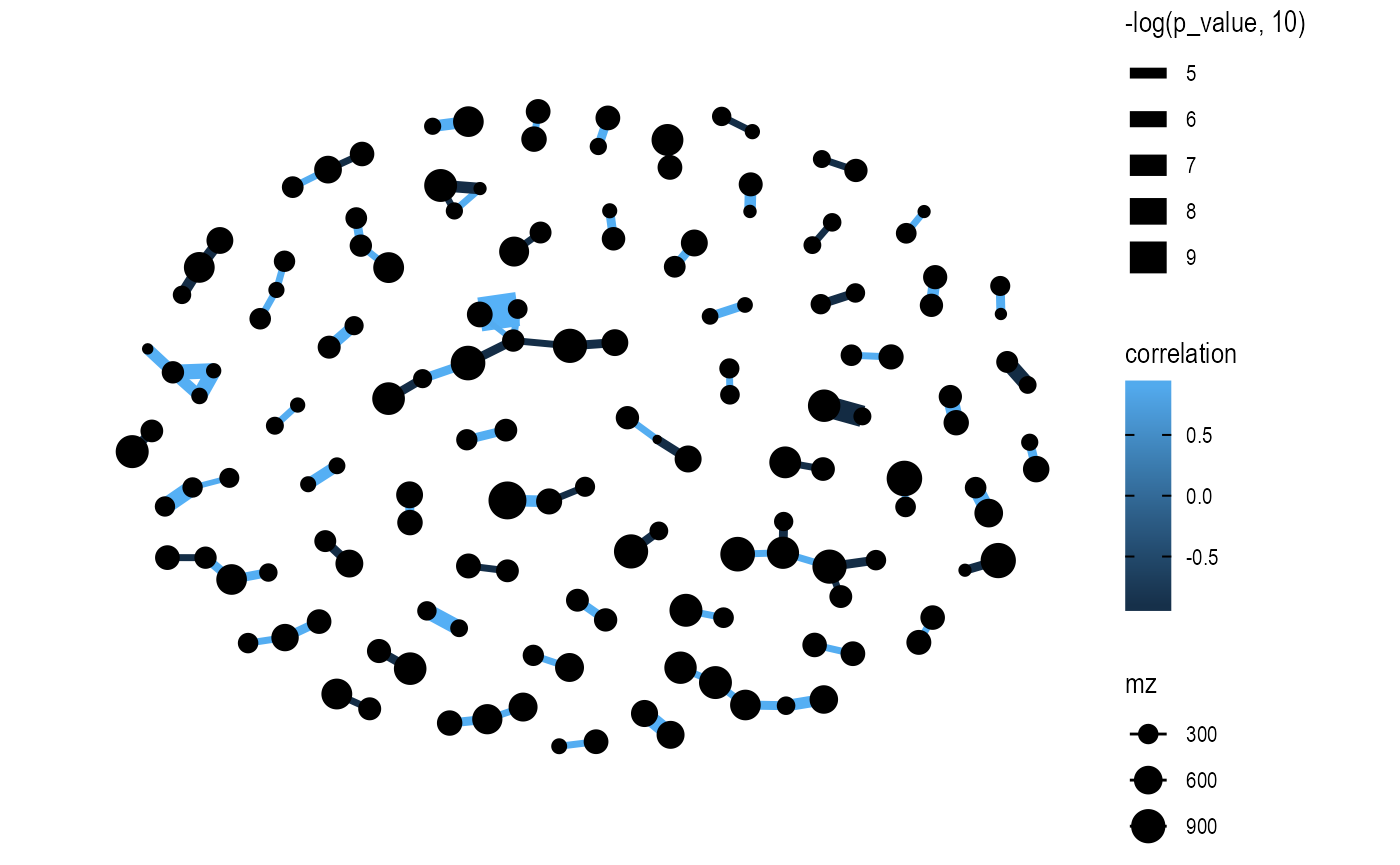
Session information
sessionInfo()
#> R version 4.1.2 (2021-11-01)
#> Platform: x86_64-apple-darwin17.0 (64-bit)
#> Running under: macOS Big Sur 10.16
#>
#> Matrix products: default
#> BLAS:   /Library/Frameworks/R.framework/Versions/4.1/Resources/lib/libRblas.0.dylib
#> LAPACK: /Library/Frameworks/R.framework/Versions/4.1/Resources/lib/libRlapack.dylib
#>
#> locale:
#> [1] en_US.UTF-8/en_US.UTF-8/en_US.UTF-8/C/en_US.UTF-8/en_US.UTF-8
#>
#> attached base packages:
#> [1] stats     graphics  grDevices utils     datasets  methods   base
#>
#> other attached packages:
#> [1] ggraph_2.0.5       dplyr_1.0.8        ggfortify_0.4.14   ggplot2_3.3.5
#> [5] magrittr_2.0.2     masstools_0.99.3   massdataset_0.99.8 massstat_0.99.6
#>
#> loaded via a namespace (and not attached):
#>   [1] readxl_1.3.1          snow_0.4-4            backports_1.4.1
#>   [4] circlize_0.4.14       Hmisc_4.6-0           systemfonts_1.0.3
#>   [7] plyr_1.8.6            igraph_1.2.11         lazyeval_0.2.2
#>  [10] splines_4.1.2         BiocParallel_1.28.3   crosstalk_1.2.0
#>  [13] leaflet_2.1.0         digest_0.6.29         yulab.utils_0.0.4
#>  [16] foreach_1.5.2         htmltools_0.5.2       viridis_0.6.2
#>  [19] fansi_1.0.2           checkmate_2.0.0       memoise_2.0.1
#>  [22] cluster_2.1.2         doParallel_1.0.17     openxlsx_4.2.5
#>  [25] tzdb_0.2.0            limma_3.50.0          graphlayouts_0.8.0
#>  [28] readr_2.1.2           ComplexHeatmap_2.10.0 extrafont_0.17
#>  [31] matrixStats_0.61.0    rARPACK_0.11-0        extrafontdb_1.0
#>  [34] pkgdown_2.0.2         jpeg_0.1-9            colorspace_2.0-2
#>  [37] ggrepel_0.9.1         textshaping_0.3.6     xfun_0.29
#>  [40] crayon_1.5.0          jsonlite_1.7.3        impute_1.68.0
#>  [43] survival_3.2-13       iterators_1.0.14      glue_1.6.1
#>  [46] polyclip_1.10-0       gtable_0.3.0          zlibbioc_1.40.0
#>  [49] GetoptLong_1.0.5      Rttf2pt1_1.3.9        shape_1.4.6
#>  [52] BiocGenerics_0.40.0   scales_1.1.1          vsn_3.62.0
#>  [55] DBI_1.1.2             Rcpp_1.0.8            mzR_2.28.0
#>  [58] viridisLite_0.4.0     htmlTable_2.4.0       clue_0.3-60
#>  [61] gridGraphics_0.5-1    foreign_0.8-82        preprocessCore_1.56.0
#>  [64] clisymbols_1.2.0      Formula_1.2-4         stats4_4.1.2
#>  [67] MsCoreUtils_1.6.0     htmlwidgets_1.5.4     httr_1.4.2
#>  [70] RColorBrewer_1.1-2    ellipsis_0.3.2        farver_2.1.0
#>  [73] pkgconfig_2.0.3       XML_3.99-0.8          nnet_7.3-17
#>  [76] sass_0.4.0            utf8_1.2.2            labeling_0.4.2
#>  [79] ggplotify_0.1.0       reshape2_1.4.4        tidyselect_1.1.1
#>  [82] rlang_1.0.1           munsell_0.5.0         cellranger_1.1.0
#>  [85] tools_4.1.2           cachem_1.0.6          cli_3.2.0
#>  [88] generics_0.1.2        evaluate_0.15         stringr_1.4.0
#>  [91] fastmap_1.1.0         mzID_1.32.0           yaml_2.3.4
#>  [94] ragg_1.2.1            knitr_1.37            fs_1.5.2
#>  [97] tidygraph_1.2.0       zip_2.2.0             purrr_0.3.4
#> [100] ncdf4_1.19            pbapply_1.5-0         compiler_4.1.2
#> [103] rstudioapi_0.13       plotly_4.10.0         png_0.1-7
#> [106] affyio_1.64.0         tweenr_1.0.2          tibble_3.1.6
#> [109] bslib_0.3.1           stringi_1.7.6         highr_0.9
#> [112] RSpectra_0.16-0       desc_1.4.0            MSnbase_2.20.4
#> [115] lattice_0.20-45       ProtGenerics_1.26.0   Matrix_1.4-0
#> [118] ggsci_2.9             vctrs_0.3.8           pillar_1.7.0
#> [121] lifecycle_1.0.1       BiocManager_1.30.16   jquerylib_0.1.4
#> [124] MALDIquant_1.21       GlobalOptions_0.1.2   data.table_1.14.2
#> [127] corpcor_1.6.10        patchwork_1.1.1       R6_2.5.1
#> [130] latticeExtra_0.6-29   pcaMethods_1.86.0     affy_1.72.0
#> [133] gridExtra_2.3         IRanges_2.28.0        codetools_0.2-18
#> [136] fastDummies_1.6.3     MASS_7.3-55           assertthat_0.2.1
#> [139] rprojroot_2.0.2       rjson_0.2.21          withr_2.4.3
#> [142] S4Vectors_0.32.3      hms_1.1.1             parallel_4.1.2
#> [145] mixOmics_6.18.1       grid_4.1.2            rpart_4.1.16
#> [148] tidyr_1.2.0           rmarkdown_2.11        ggforce_0.3.3
#> [151] Biobase_2.54.0        base64enc_0.1-3       ellipse_0.4.2